|
Current Price:
U308 $88.00/lb*
Effective April 29, 2024
(-$1.75 from survey 1 weeks
prior).
Commentary Update as of
September-2023
Uranium is officially in a
bull market with a 20% rise in price so far in 2023, vastly
outperforming other metals markets.
Uranium scaled $60 per pound on Friday for the first time
since 2011. The breakthrough for the nuclear fuel after a
decade in the doldrums coincided with the last day of the
World Nuclear Symposium in London.
The World Nuclear Association’s (WNA) biennial report
provides long and medium term projections and insights into
the more obscure corners of the global supply chain.
The report has done little to worry uranium bulls, the ranks
of which has grown large in the past couple of years, as the
role nuclear could play in the green energy transition
becomes obvious even to long term critics of the renewable
source.
The nuclear option
The WNA report predicts world reactor requirements for
uranium to surge to almost 130,000 tonnes (~285 million
pounds) in 2040. That’s up from an estimate of 65,650 tonnes
in 2023.
Under the World Nuclear Association upper forecast that
total rise to 184,300 tonnes and even its most pessimistic
forecast – 87,000 tonnes in 2040 – translates to a healthy
rise in demand for the commodity.
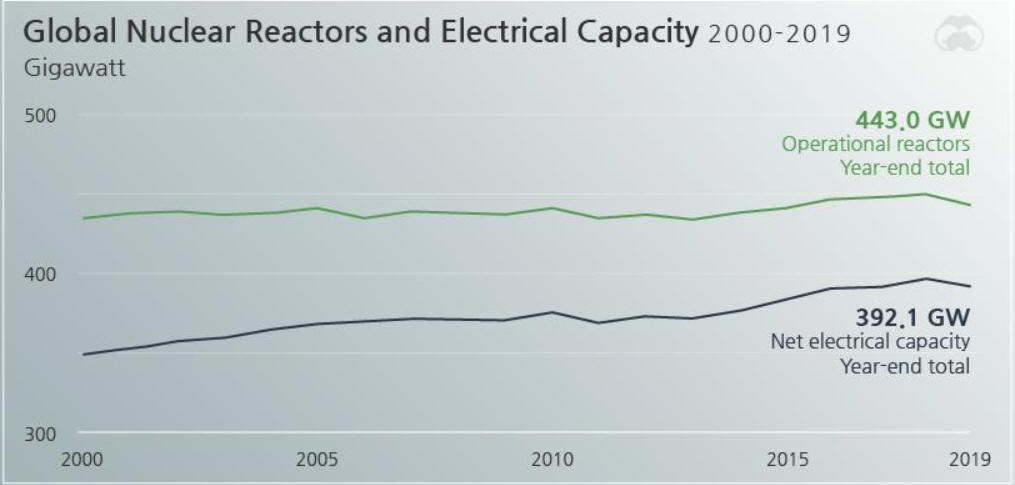
From the current 391 gigawatts electricity of operable
nuclear plants, the WNA now projects capacity will reach 686
GW by 2040 under its base case scenario. It’s a hefty
increase of 71 GW from the organization's estimates in its
the 2021 report.
Uranium price makes fresh decade high as forecasts grow
rosier
The bulk of new generating capacity will be located in
China, which is aggressively pursuing nuclear energy to
replace coal, which supplies the bulk of the country’s
energy needs currently. The country has 23 reactors under
construction, 23 planned and a further 168 proposed to add
to its current operating fleet of 53 reactors. Worldwide 436
reactors are currently in operation and another 59 under
construction.
Overall demand projections from the WNA have increased in
the last update, with 4.1% CAGR demand growth expected
through 2040, from 3.1% in its 2021 report.
SMR
The role small modular reactors can play in stoking demand
has kept uranium watchers excited for decades, but now the
promised spike in demand from these technologies are finally
set to have a meaningful impact. Russia is a leader in the
field with two floating SMR reactors entering commercial
operation in 2020 and China is expected to turn the switch
on a land-based reactor in 2025.
A significant portion of the WNA’s upward growth adjustments
can be attributed to the accelerated adoption of SMRs and
the body believes installed capacity will reach 31 GW by
2040.
In a note, BMO Capital Markets says the WNA’s forecasts for
SMRs appear to conservative considering the potential of the
technology’s use in everything from shipping to data centres.
The investment bank’s own forecasts point to 58GW of
installed SMR capacity by the end of the next decade or
around a tenth of nuclear generation capacity which is in
line with the upper band of the WNA’s predictions.
Remote chances
BMO sees SMR boosting mining companies plans around
decarbonisation of operations many of which are located in
remote areas far from power grids. Many mines have replaced
diesel generators with renewable sources like solar power,
but for that you need ample space and the right climate:
“For others, particularly in colder climates such as Canada,
we do see potential for micro-scale nuclear power solutions.
Uranium price makes fresh decade high as forecasts grow
rosier
“Indeed, in much the same way as platinum producers are
championing hydrogen-based trucks by installing them at
their operations, we see an opportunity where uranium miners
could potentially be pioneers in the use of SMRs.”
BMO believes remote mine sites have the best potential for
SMR installations after marine freight and steelmaking.
Security and secondary supply
The report was likely already at the printers when the coup
in Niger grabbed newspaper headlines – but the WNA does
point to “geopolitical instability, notably resulting from
the Russia-Ukraine” resulting in increased interest in
nuclear power for energy security and sovereignty.”
“The same instability has had significant implications for
the globalized market for nuclear fuel cycle services, with
utilities, suppliers and governments in North America and
Europe pursuing opportunities to diversify supplies,” the
WNA says.
WNA believes in the near term, secondary supplies of uranium
will continue to play a role in bridging the gap between
supply and demand as it has for more than three decades. But
there is good news for miners longer term and the WNA
acknowledges in its report the need for new greenfield
uranium projects.
“However, secondary supply is projected to have a gradually
diminishing role in the world market, decreasing from the
current level in supplying 11-14% of reactor uranium
requirements to 4-11% in 2050.“
Secondary supplies include, among others, reprocessed
nuclear fuel, down blending of highly enriched uranium in
nuclear weapons, tailing re-enrichment and stockpiles from
oversupply between 1950–1970, BMO explains. BMO estimates
roughly 3.7 years’ worth of reactor requirements are
currently held as inventory.
------ ------ ------
Nuclear power made up 4.3% of
the global energy mix in 2020, supplying many nations with
carbon-free electricity.
Here are the world's nuclear energy powerhouses:
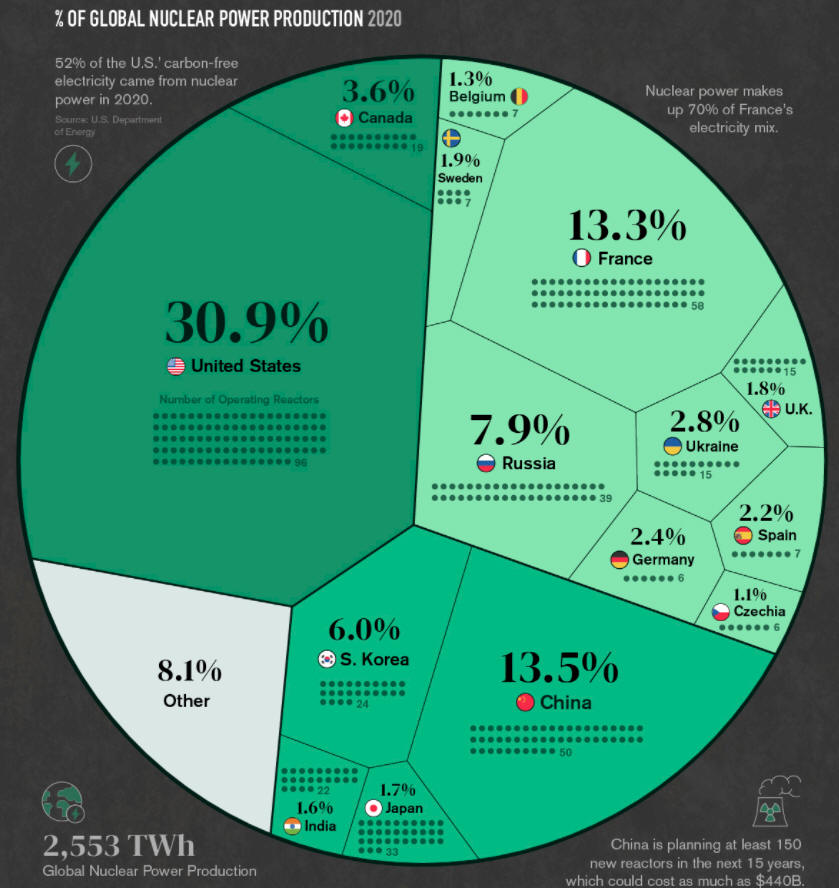
Nuclear Power Production by Country
Nearly 450 reactors around the world supply various
nations with nuclear power, combining for about 10% of the
world’s electricity, or about 4% of the global energy mix.
But while some countries are turning to nuclear as a clean
energy source, nuclear energy generation overall has seen a
slowdown since its peak in the 1990s.
The above image breaks down nuclear electricity generation
by country in 2020 using data from the Power Reactor
Information System (PRIS).
Ranked: The Top 15 Countries for Nuclear Power
Just 15 countries account for more than 91% of global
nuclear power production. Here’s how much energy these
countries produced in 2020:
|
Rank |
Country |
Number of Operating
Reactors |
Nuclear Electricity
Supplied
[GWh] |
% share |
|
#1 |
U.S. |
96 |
789,919 |
30.9% |
|
#2 |
China |
50 |
344,748 |
13.5% |
|
#3 |
France |
58 |
338,671 |
13.3% |
|
#4 |
Russia |
39 |
201,821 |
7.9% |
|
#5 |
South Korea |
24 |
152,583 |
6.0% |
|
#6 |
Canada |
19 |
92,166 |
3.6% |
|
#7 |
Ukraine |
15 |
71,550 |
2.8% |
|
#8 |
Germany |
6 |
60,918 |
2.4% |
|
#9 |
Spain |
7 |
55,825 |
2.2% |
|
#10 |
Sweden |
7 |
47,362 |
1.9% |
|
#11 |
U.K. |
15 |
45,668 |
1.8% |
|
#12 |
Japan |
33 |
43,099 |
1.7% |
|
#13 |
India |
22 |
40,374 |
1.6% |
|
#14 |
Belgium |
7 |
32,793 |
1.3% |
|
#15 |
Czechia |
6 |
28,372 |
1.1% |
| |
Rest of the World
|
44 |
207,340 |
8.1% |
| |
Total |
448 |
2,553,208 |
100.0% |
In the U.S., nuclear power produces
over 50% of the country’s clean electricity. Additionally,
88 of the country’s 96 operating reactors in 2020 received
approvals for a 20-year life extension.
China, the world’s second-largest nuclear power producer, is
investing further in nuclear energy in a bid to achieve its
climate goals. The plan, which includes building 150 new
reactors by 2035, could cost as much as $440 billion.
On the other hand, European opinions on nuclear energy are
mixed. Germany is the eighth-largest on the list but plans
to shutter its last operating reactor in 2022 as part of its
nuclear phase-out. France, meanwhile, plans to expand its
nuclear capacity.
Which Countries Rely Most on Nuclear Energy?
Although total electricity generation is useful for a
high-level global comparison, it’s important to remember
that there are some smaller countries not featured above
where nuclear is still an important part of the electricity
mix.
Here’s a breakdown based on the share of nuclear energy
in a country’s electricity mix:
|
Rank |
Country |
Nuclear Share of
Electricity Mix |
|
#1 |
France |
70.6% |
|
#2 |
Slovakia |
53.1% |
|
#3 |
Ukraine |
51.2% |
|
#4 |
Hungary |
48.0% |
|
#5 |
Bulgaria |
40.8% |
|
#6 |
Belgium |
39.1% |
|
#7 |
Slovenia |
37.8% |
|
#8 |
Czechia |
37.3% |
|
#9 |
Armenia |
34.5% |
|
#10 |
Finland |
33.9% |
|
#11 |
Switzerland |
32.9% |
|
#12 |
Sweden |
29.8% |
|
#13 |
South Korea |
29.6% |
|
#14 |
Spain |
22.2% |
|
#15 |
Russia |
20.6% |
|
#16 |
Romania |
19.9% |
|
#17 |
United States |
19.7% |
|
#18 |
Canada |
14.6% |
|
#19 |
United Kingdom |
14.5% |
|
#20 |
Germany |
11.3% |
European countries dominate the
leaderboard with 14 of the top 15 spots, including France,
where nuclear power is the country’s largest source of
electricity.
It’s interesting to note that only a few of these countries
are top producers of nuclear in absolute terms. For example,
in Slovakia, nuclear makes up 53.6% of the electricity
mix—however, the country’s four reactors make up less than
1% of total global operating capacity.
On the flipside, the U.S. ranks 17th by share of nuclear
power in its mix, despite producing 31% of global nuclear
electricity in 2020. This discrepancy is largely due to size
and population. European countries are much smaller and
produce less electricity overall than larger countries like
the U.S. and China.
The Future of Nuclear Power
The nuclear power landscape is constantly changing.
There were over 50 additional nuclear reactors under
construction in 2020, and hundreds more are planned
primarily in Asia.
As countries turn away from fossil fuels and embrace
carbon-free energy sources, nuclear energy might see a
resurgence in the global energy mix despite the phase-outs
planned in several countries around he globe.
Click to see Uranium Futures =>
Uranium Futures
- CME, or
click here
Uranium/Nuclear focused ETFs:
Click to see
Global X Uranium ETF (URA) =>
Uranium
ETF
Other uranium
related ETF style investment vehicles (focused on nuclear
energy but are not limited to uranium mining and are not direct
competition for URA):
Market Vectors Nuclear Energy (NLR),
and Barclays iShares Global Nuclear Energy (NUCL)
Although we often reference
the spot price of uranium, the long-term price is what
really counts as only a small fraction of the metal is
actually traded on spot prices; over six times more uranium
is traded in long-term market prices than in the spot market
price. The long term market price is consistently and
significantly higher than spot. |
Welcome to Uranium Miner
We track active uranium mining
interests worldwide & provide insight into uranium resource
companies that offer outstanding properties, management and
experience in the mining / exploration industry.
|